Forecast
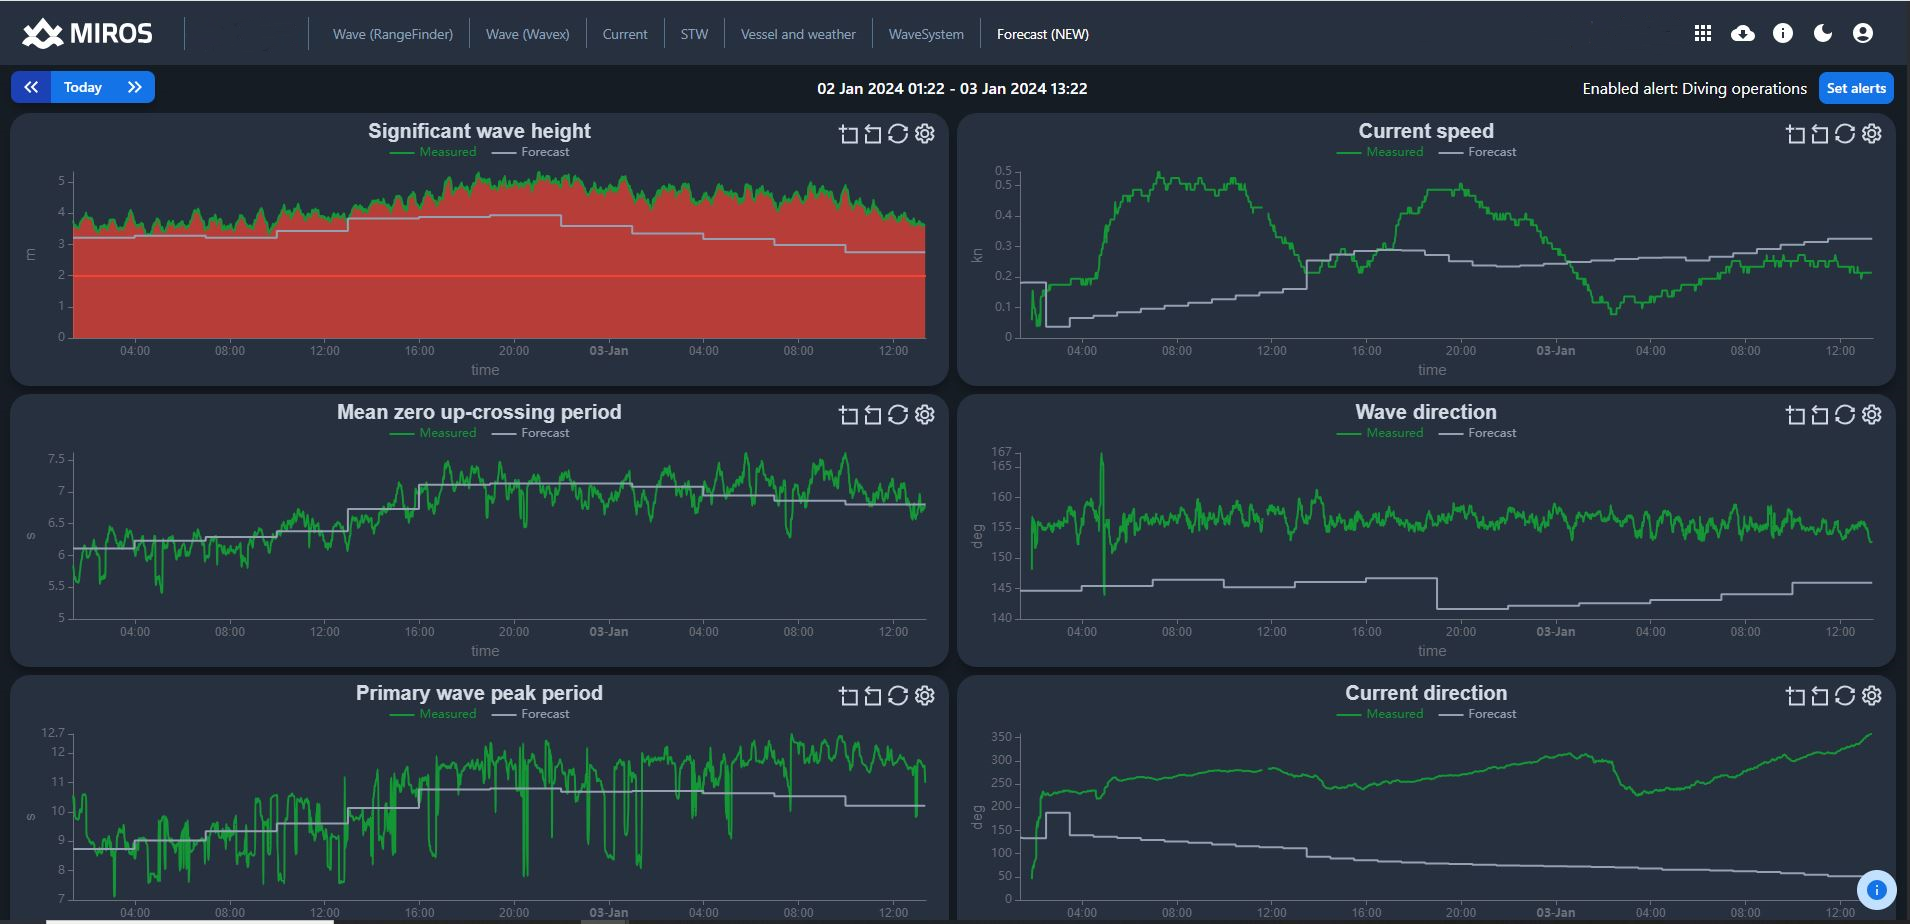
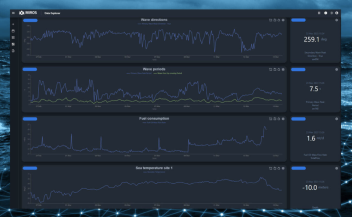
Forecast is an indispensable application where the ocean condition forecast versus measured real-time conditions is visualized in an easy and intuitive dashboard.
The application helps to elevate maritime safety and operational efficiency due to the integration of forecasts with real-time measured ocean data.


Unified and dynamic dashboards combining real-time and forecasted wave data
In the ever-evolving landscape of maritime and offshore operations, staying vigilant and ahead of environmental conditions is paramount for ensuring safety, efficiency, and cost-effectiveness.
With Forecast, you get forecasted ocean state data together with real-time measured data integrated into the easy and intuitive Miros Cloud dashboard.
Why Forecast?
Navigate seamlessly through real-time measured data together with the forecast up tp 10 days in time-series visualizations, providing operators with an accurate and up-to-the-minute view of environmental conditions and facilitating precise decision-making.
Forecast goes beyond the present, allowing users to delve into historical data in the same dashboard for up to 7 days. This feature aids in trend analysis, pattern recognition, and improved long-term planning.
The application offers personalized alerts for each chart, enabling a proactive response when specific wave conditions surpass predefined limits to ensure the safety of offshore assets and personnel.
By analyzing real-time and forecasted data trends, operators can make informed decisions regarding offshore operations, crew deployment, and equipment usage. This results in enhanced operational efficiency and overall performance.
Minimizing downtime and reducing the economic impact on offshore activities, by anticipating adverse weather conditions or operational challenges using the forecasted data for up to 10 days.
Measured versus forecast data insights presented in a simple dashboard, empowers operators to implement proactive maintenance schedules. This optimization not only extends the lifespan of assets but also minimizes downtime for enhanced asset management.
Data Analysts: Data Explorer is a great tool for data analysts who want to dive deep into their data and discover meaningful insights. With Data Explorer’s powerful querying and visualization features, you can quickly identify patterns and trends in your data that might otherwise be difficult to spot.
Operations teams: Can use Data Explorer to gain a better understanding of their operations and make data-driven decisions.
Site managers: With the ability to analyse data from multiple sources, Data Explorer can help site managers to identify opportunities for optimising their processes and reach their operational targets.
Who can benefit?
Marine Operations teams:
Teams can make data-led decisions by leveraging both forecast and real-time data in one simple dashboard. Enhanced by visual alarms, operations teams can stay up-to-date when specific wave conditions surpass predefined limits keeping the operations safe and efficient.
Site managers:
Real-time measurements combined with forecast data empower site managers to optimize the site efficiently. This optimization extends to various offshore activities on vessels, platforms, wind farms ports, and coastlines, ultimately enhancing the ability to meet the project targets and within the regulatory safety policies.
Control Room Operators:
Assisting control room operators in the continuous assessment of both real-time and forecasted wave and weather data, enabling them to dynamically adjust their strategies.
Diving and ROV Technicians:
In the challenging conditions of high seas with substantial waves, potential risks to ROVs are significant, particularly during deployment, maneuvering, or retrieval. Having precise information about both current and forecasted sea states empowers technicians to make well-informed decisions.


